Dataquest の Guided Tour。pandas、matplotlib、seaborn を使って Pixar の映画評価を分析する。
import pandas as pd
import matplotlib.pyplot as plt
import seaborn as sns
%matplotlib inline

pixar_movies = pd.read_csv('PixarMovies.csv')
print(pixar_movies.shape)
pixar_movies.head(3)
|
Year Released |
Movie |
Length |
RT Score |
IMDB Score |
Metacritic Score |
Opening Weekend |
Worldwide Gross |
Domestic Gross |
Adjusted Domestic Gross |
International Gross |
Domestic % |
International % |
Production Budget |
Oscars Nominated |
Oscars Won |
| 0 |
1995 |
Toy Story |
81 |
100 |
8.3 |
92 |
29.14 |
362.0 |
191.8 |
356.21 |
170.2 |
52.98% |
47.02% |
30 |
3.0 |
0.0 |
| 1 |
1998 |
A Bug's Life |
96 |
92 |
7.2 |
77 |
33.26 |
363.4 |
162.8 |
277.18 |
200.6 |
44.80% |
55.20% |
45 |
1.0 |
0.0 |
| 2 |
1999 |
Toy Story 2 |
92 |
100 |
7.9 |
88 |
57.39 |
485.0 |
245.9 |
388.43 |
239.2 |
50.70% |
49.32% |
90 |
1.0 |
0.0 |
Year Released                int64
Movie                       object
Length                       int64
RT Score                     int64
IMDB Score                 float64
Metacritic Score             int64
Opening Weekend            float64
Worldwide Gross            float64
Domestic Gross             float64
Adjusted Domestic Gross    float64
International Gross        float64
Domestic %                  object
International %             object
Production Budget            int64
Oscars Nominated           float64
Oscars Won                 float64
dtype: object
|
Year Released |
Length |
RT Score |
IMDB Score |
Metacritic Score |
Opening Weekend |
Worldwide Gross |
Domestic Gross |
Adjusted Domestic Gross |
International Gross |
Production Budget |
Oscars Nominated |
Oscars Won |
| count |
15.000000 |
15.000000 |
15.000000 |
15.000000 |
15.000000 |
15.000000 |
15.000000 |
15.000000 |
15.000000 |
15.000000 |
15.000000 |
14.000000 |
14.000000 |
| mean |
2006.066667 |
101.533333 |
89.333333 |
7.846667 |
82.800000 |
67.990667 |
612.486667 |
258.506667 |
318.448000 |
353.986667 |
133.400000 |
2.857143 |
0.785714 |
| std |
5.933761 |
9.927355 |
16.451950 |
0.655599 |
12.119642 |
23.270468 |
190.193934 |
66.518284 |
73.321064 |
135.061615 |
59.696614 |
2.032700 |
0.801784 |
| min |
1995.000000 |
81.000000 |
39.000000 |
6.300000 |
57.000000 |
29.140000 |
362.000000 |
162.800000 |
194.430000 |
170.200000 |
30.000000 |
0.000000 |
0.000000 |
| 25% |
2002.000000 |
96.000000 |
85.000000 |
7.300000 |
75.000000 |
58.755000 |
503.150000 |
215.100000 |
261.350000 |
256.050000 |
91.000000 |
1.000000 |
0.000000 |
| 50% |
2007.000000 |
102.000000 |
96.000000 |
8.000000 |
88.000000 |
66.300000 |
559.900000 |
245.900000 |
318.900000 |
336.600000 |
150.000000 |
3.000000 |
1.000000 |
| 75% |
2010.500000 |
109.000000 |
98.500000 |
8.300000 |
92.000000 |
76.450000 |
704.200000 |
280.750000 |
361.165000 |
427.800000 |
182.500000 |
5.000000 |
1.500000 |
| max |
2015.000000 |
116.000000 |
100.000000 |
8.800000 |
96.000000 |
110.310000 |
1063.200000 |
415.000000 |
457.460000 |
648.200000 |
200.000000 |
6.000000 |
2.000000 |
pixar_movies['Domestic %'] = pixar_movies['Domestic %'].str.rstrip('%').astype(float)
pixar_movies['International %'] = pixar_movies['International %'].str.rstrip('%').astype(float)
pixar_movies
|
Year Released |
Movie |
Length |
RT Score |
IMDB Score |
Metacritic Score |
Opening Weekend |
Worldwide Gross |
Domestic Gross |
Adjusted Domestic Gross |
International Gross |
Domestic % |
International % |
Production Budget |
Oscars Nominated |
Oscars Won |
| 0 |
1995 |
Toy Story |
81 |
100 |
8.3 |
92 |
29.14 |
362.0 |
191.8 |
356.21 |
170.2 |
52.98 |
47.02 |
30 |
3.0 |
0.0 |
| 1 |
1998 |
A Bug's Life |
96 |
92 |
7.2 |
77 |
33.26 |
363.4 |
162.8 |
277.18 |
200.6 |
44.80 |
55.20 |
45 |
1.0 |
0.0 |
| 2 |
1999 |
Toy Story 2 |
92 |
100 |
7.9 |
88 |
57.39 |
485.0 |
245.9 |
388.43 |
239.2 |
50.70 |
49.32 |
90 |
1.0 |
0.0 |
| 3 |
2001 |
Monsters, Inc. |
90 |
96 |
8.1 |
78 |
62.58 |
528.8 |
255.9 |
366.12 |
272.9 |
48.39 |
51.61 |
115 |
3.0 |
1.0 |
| 4 |
2003 |
Finding Nemo |
104 |
99 |
8.2 |
90 |
70.25 |
895.6 |
339.7 |
457.46 |
555.9 |
37.93 |
62.07 |
94 |
4.0 |
1.0 |
| 5 |
2004 |
The Incredibles |
115 |
97 |
8.0 |
90 |
70.47 |
631.4 |
261.4 |
341.28 |
370.0 |
41.40 |
58.60 |
92 |
4.0 |
2.0 |
| 6 |
2006 |
Cars |
116 |
74 |
7.2 |
73 |
60.12 |
462.0 |
244.1 |
302.59 |
217.9 |
52.84 |
47.16 |
70 |
2.0 |
0.0 |
| 7 |
2007 |
Ratatouille |
111 |
96 |
8.0 |
96 |
47.00 |
623.7 |
206.4 |
243.65 |
417.3 |
33.09 |
66.91 |
150 |
5.0 |
1.0 |
| 8 |
2008 |
WALL-E |
97 |
96 |
8.4 |
94 |
63.10 |
521.3 |
223.8 |
253.11 |
297.5 |
42.93 |
57.07 |
180 |
6.0 |
1.0 |
| 9 |
2009 |
Up |
96 |
98 |
8.3 |
88 |
68.11 |
731.3 |
293.0 |
318.90 |
438.3 |
40.07 |
59.93 |
175 |
5.0 |
2.0 |
| 10 |
2010 |
Toy Story 3 |
103 |
99 |
8.4 |
92 |
110.31 |
1063.2 |
415.0 |
423.88 |
648.2 |
39.03 |
60.97 |
200 |
5.0 |
2.0 |
| 11 |
2011 |
Cars 2 |
113 |
39 |
6.3 |
57 |
109.00 |
559.9 |
191.5 |
194.43 |
368.4 |
34.20 |
65.80 |
200 |
0.0 |
0.0 |
| 12 |
2012 |
Brave |
100 |
78 |
7.2 |
69 |
66.30 |
539.0 |
237.3 |
243.39 |
301.7 |
44.03 |
55.97 |
185 |
1.0 |
1.0 |
| 13 |
2013 |
Monsters University |
107 |
78 |
7.4 |
65 |
82.43 |
743.6 |
268.5 |
269.59 |
475.1 |
36.11 |
63.89 |
200 |
0.0 |
0.0 |
| 14 |
2015 |
Inside Out |
102 |
98 |
8.8 |
93 |
90.40 |
677.1 |
340.5 |
340.50 |
336.6 |
50.29 |
49.71 |
175 |
NaN |
NaN |
pixar_movies['IMDB Score'] = pixar_movies['IMDB Score'] * 10
pixar_movies
|
Year Released |
Movie |
Length |
RT Score |
IMDB Score |
Metacritic Score |
Opening Weekend |
Worldwide Gross |
Domestic Gross |
Adjusted Domestic Gross |
International Gross |
Domestic % |
International % |
Production Budget |
Oscars Nominated |
Oscars Won |
| 0 |
1995 |
Toy Story |
81 |
100 |
83.0 |
92 |
29.14 |
362.0 |
191.8 |
356.21 |
170.2 |
52.98 |
47.02 |
30 |
3.0 |
0.0 |
| 1 |
1998 |
A Bug's Life |
96 |
92 |
72.0 |
77 |
33.26 |
363.4 |
162.8 |
277.18 |
200.6 |
44.80 |
55.20 |
45 |
1.0 |
0.0 |
| 2 |
1999 |
Toy Story 2 |
92 |
100 |
79.0 |
88 |
57.39 |
485.0 |
245.9 |
388.43 |
239.2 |
50.70 |
49.32 |
90 |
1.0 |
0.0 |
| 3 |
2001 |
Monsters, Inc. |
90 |
96 |
81.0 |
78 |
62.58 |
528.8 |
255.9 |
366.12 |
272.9 |
48.39 |
51.61 |
115 |
3.0 |
1.0 |
| 4 |
2003 |
Finding Nemo |
104 |
99 |
82.0 |
90 |
70.25 |
895.6 |
339.7 |
457.46 |
555.9 |
37.93 |
62.07 |
94 |
4.0 |
1.0 |
| 5 |
2004 |
The Incredibles |
115 |
97 |
80.0 |
90 |
70.47 |
631.4 |
261.4 |
341.28 |
370.0 |
41.40 |
58.60 |
92 |
4.0 |
2.0 |
| 6 |
2006 |
Cars |
116 |
74 |
72.0 |
73 |
60.12 |
462.0 |
244.1 |
302.59 |
217.9 |
52.84 |
47.16 |
70 |
2.0 |
0.0 |
| 7 |
2007 |
Ratatouille |
111 |
96 |
80.0 |
96 |
47.00 |
623.7 |
206.4 |
243.65 |
417.3 |
33.09 |
66.91 |
150 |
5.0 |
1.0 |
| 8 |
2008 |
WALL-E |
97 |
96 |
84.0 |
94 |
63.10 |
521.3 |
223.8 |
253.11 |
297.5 |
42.93 |
57.07 |
180 |
6.0 |
1.0 |
| 9 |
2009 |
Up |
96 |
98 |
83.0 |
88 |
68.11 |
731.3 |
293.0 |
318.90 |
438.3 |
40.07 |
59.93 |
175 |
5.0 |
2.0 |
| 10 |
2010 |
Toy Story 3 |
103 |
99 |
84.0 |
92 |
110.31 |
1063.2 |
415.0 |
423.88 |
648.2 |
39.03 |
60.97 |
200 |
5.0 |
2.0 |
| 11 |
2011 |
Cars 2 |
113 |
39 |
63.0 |
57 |
109.00 |
559.9 |
191.5 |
194.43 |
368.4 |
34.20 |
65.80 |
200 |
0.0 |
0.0 |
| 12 |
2012 |
Brave |
100 |
78 |
72.0 |
69 |
66.30 |
539.0 |
237.3 |
243.39 |
301.7 |
44.03 |
55.97 |
185 |
1.0 |
1.0 |
| 13 |
2013 |
Monsters University |
107 |
78 |
74.0 |
65 |
82.43 |
743.6 |
268.5 |
269.59 |
475.1 |
36.11 |
63.89 |
200 |
0.0 |
0.0 |
| 14 |
2015 |
Inside Out |
102 |
98 |
88.0 |
93 |
90.40 |
677.1 |
340.5 |
340.50 |
336.6 |
50.29 |
49.71 |
175 |
NaN |
NaN |
filtered_pixar = pixar_movies.dropna()
filtered_pixar
|
Year Released |
Movie |
Length |
RT Score |
IMDB Score |
Metacritic Score |
Opening Weekend |
Worldwide Gross |
Domestic Gross |
Adjusted Domestic Gross |
International Gross |
Domestic % |
International % |
Production Budget |
Oscars Nominated |
Oscars Won |
| 0 |
1995 |
Toy Story |
81 |
100 |
83.0 |
92 |
29.14 |
362.0 |
191.8 |
356.21 |
170.2 |
52.98 |
47.02 |
30 |
3.0 |
0.0 |
| 1 |
1998 |
A Bug's Life |
96 |
92 |
72.0 |
77 |
33.26 |
363.4 |
162.8 |
277.18 |
200.6 |
44.80 |
55.20 |
45 |
1.0 |
0.0 |
| 2 |
1999 |
Toy Story 2 |
92 |
100 |
79.0 |
88 |
57.39 |
485.0 |
245.9 |
388.43 |
239.2 |
50.70 |
49.32 |
90 |
1.0 |
0.0 |
| 3 |
2001 |
Monsters, Inc. |
90 |
96 |
81.0 |
78 |
62.58 |
528.8 |
255.9 |
366.12 |
272.9 |
48.39 |
51.61 |
115 |
3.0 |
1.0 |
| 4 |
2003 |
Finding Nemo |
104 |
99 |
82.0 |
90 |
70.25 |
895.6 |
339.7 |
457.46 |
555.9 |
37.93 |
62.07 |
94 |
4.0 |
1.0 |
| 5 |
2004 |
The Incredibles |
115 |
97 |
80.0 |
90 |
70.47 |
631.4 |
261.4 |
341.28 |
370.0 |
41.40 |
58.60 |
92 |
4.0 |
2.0 |
| 6 |
2006 |
Cars |
116 |
74 |
72.0 |
73 |
60.12 |
462.0 |
244.1 |
302.59 |
217.9 |
52.84 |
47.16 |
70 |
2.0 |
0.0 |
| 7 |
2007 |
Ratatouille |
111 |
96 |
80.0 |
96 |
47.00 |
623.7 |
206.4 |
243.65 |
417.3 |
33.09 |
66.91 |
150 |
5.0 |
1.0 |
| 8 |
2008 |
WALL-E |
97 |
96 |
84.0 |
94 |
63.10 |
521.3 |
223.8 |
253.11 |
297.5 |
42.93 |
57.07 |
180 |
6.0 |
1.0 |
| 9 |
2009 |
Up |
96 |
98 |
83.0 |
88 |
68.11 |
731.3 |
293.0 |
318.90 |
438.3 |
40.07 |
59.93 |
175 |
5.0 |
2.0 |
| 10 |
2010 |
Toy Story 3 |
103 |
99 |
84.0 |
92 |
110.31 |
1063.2 |
415.0 |
423.88 |
648.2 |
39.03 |
60.97 |
200 |
5.0 |
2.0 |
| 11 |
2011 |
Cars 2 |
113 |
39 |
63.0 |
57 |
109.00 |
559.9 |
191.5 |
194.43 |
368.4 |
34.20 |
65.80 |
200 |
0.0 |
0.0 |
| 12 |
2012 |
Brave |
100 |
78 |
72.0 |
69 |
66.30 |
539.0 |
237.3 |
243.39 |
301.7 |
44.03 |
55.97 |
185 |
1.0 |
1.0 |
| 13 |
2013 |
Monsters University |
107 |
78 |
74.0 |
65 |
82.43 |
743.6 |
268.5 |
269.59 |
475.1 |
36.11 |
63.89 |
200 |
0.0 |
0.0 |
pixar_movies.set_index('Movie', inplace=True)
filtered_pixar.set_index(['Movie'], inplace=True)
|
Year Released |
Length |
RT Score |
IMDB Score |
Metacritic Score |
Opening Weekend |
Worldwide Gross |
Domestic Gross |
Adjusted Domestic Gross |
International Gross |
Domestic % |
International % |
Production Budget |
Oscars Nominated |
Oscars Won |
| Movie |
|
|
|
|
|
|
|
|
|
|
|
|
|
|
|
| Toy Story |
1995 |
81 |
100 |
83.0 |
92 |
29.14 |
362.0 |
191.8 |
356.21 |
170.2 |
52.98 |
47.02 |
30 |
3.0 |
0.0 |
| A Bug's Life |
1998 |
96 |
92 |
72.0 |
77 |
33.26 |
363.4 |
162.8 |
277.18 |
200.6 |
44.80 |
55.20 |
45 |
1.0 |
0.0 |
| Toy Story 2 |
1999 |
92 |
100 |
79.0 |
88 |
57.39 |
485.0 |
245.9 |
388.43 |
239.2 |
50.70 |
49.32 |
90 |
1.0 |
0.0 |
| Monsters, Inc. |
2001 |
90 |
96 |
81.0 |
78 |
62.58 |
528.8 |
255.9 |
366.12 |
272.9 |
48.39 |
51.61 |
115 |
3.0 |
1.0 |
| Finding Nemo |
2003 |
104 |
99 |
82.0 |
90 |
70.25 |
895.6 |
339.7 |
457.46 |
555.9 |
37.93 |
62.07 |
94 |
4.0 |
1.0 |
| The Incredibles |
2004 |
115 |
97 |
80.0 |
90 |
70.47 |
631.4 |
261.4 |
341.28 |
370.0 |
41.40 |
58.60 |
92 |
4.0 |
2.0 |
| Cars |
2006 |
116 |
74 |
72.0 |
73 |
60.12 |
462.0 |
244.1 |
302.59 |
217.9 |
52.84 |
47.16 |
70 |
2.0 |
0.0 |
| Ratatouille |
2007 |
111 |
96 |
80.0 |
96 |
47.00 |
623.7 |
206.4 |
243.65 |
417.3 |
33.09 |
66.91 |
150 |
5.0 |
1.0 |
| WALL-E |
2008 |
97 |
96 |
84.0 |
94 |
63.10 |
521.3 |
223.8 |
253.11 |
297.5 |
42.93 |
57.07 |
180 |
6.0 |
1.0 |
| Up |
2009 |
96 |
98 |
83.0 |
88 |
68.11 |
731.3 |
293.0 |
318.90 |
438.3 |
40.07 |
59.93 |
175 |
5.0 |
2.0 |
| Toy Story 3 |
2010 |
103 |
99 |
84.0 |
92 |
110.31 |
1063.2 |
415.0 |
423.88 |
648.2 |
39.03 |
60.97 |
200 |
5.0 |
2.0 |
| Cars 2 |
2011 |
113 |
39 |
63.0 |
57 |
109.00 |
559.9 |
191.5 |
194.43 |
368.4 |
34.20 |
65.80 |
200 |
0.0 |
0.0 |
| Brave |
2012 |
100 |
78 |
72.0 |
69 |
66.30 |
539.0 |
237.3 |
243.39 |
301.7 |
44.03 |
55.97 |
185 |
1.0 |
1.0 |
| Monsters University |
2013 |
107 |
78 |
74.0 |
65 |
82.43 |
743.6 |
268.5 |
269.59 |
475.1 |
36.11 |
63.89 |
200 |
0.0 |
0.0 |
| Inside Out |
2015 |
102 |
98 |
88.0 |
93 |
90.40 |
677.1 |
340.5 |
340.50 |
336.6 |
50.29 |
49.71 |
175 |
NaN |
NaN |
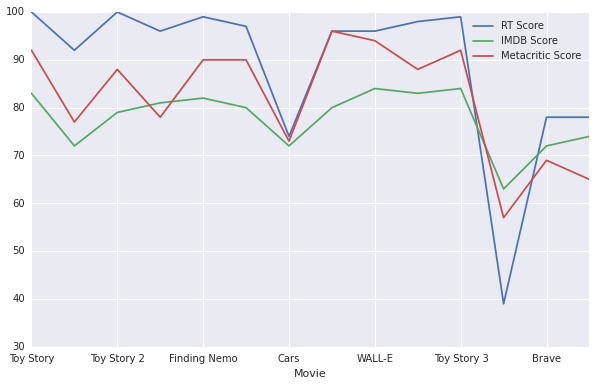
critics_reviews = filtered_pixar[['RT Score', 'IMDB Score', 'Metacritic Score']]
critics_reviews
|
RT Score |
IMDB Score |
Metacritic Score |
| Movie |
|
|
|
| Toy Story |
100 |
83.0 |
92 |
| A Bug's Life |
92 |
72.0 |
77 |
| Toy Story 2 |
100 |
79.0 |
88 |
| Monsters, Inc. |
96 |
81.0 |
78 |
| Finding Nemo |
99 |
82.0 |
90 |
| The Incredibles |
97 |
80.0 |
90 |
| Cars |
74 |
72.0 |
73 |
| Ratatouille |
96 |
80.0 |
96 |
| WALL-E |
96 |
84.0 |
94 |
| Up |
98 |
83.0 |
88 |
| Toy Story 3 |
99 |
84.0 |
92 |
| Cars 2 |
39 |
63.0 |
57 |
| Brave |
78 |
72.0 |
69 |
| Monsters University |
78 |
74.0 |
65 |
critics_reviews.plot(figsize=(10, 6))
plt.show()
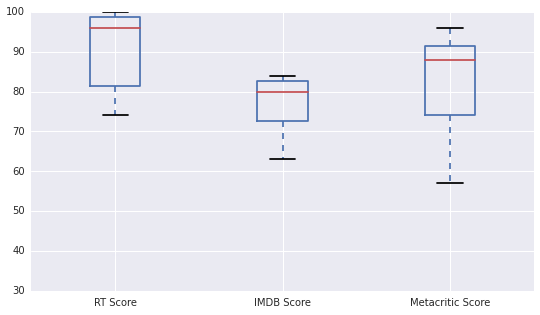
critics_reviews.plot(kind='box', figsize=(9, 5))
<matplotlib.axes._subplots.AxesSubplot at 0x7f06e351c128>
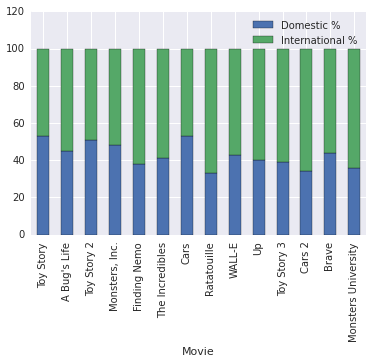
revenue_proportions = filtered_pixar[['Domestic %', 'International %']]
revenue_proportions.plot(kind='bar', stacked=True)
<matplotlib.axes._subplots.AxesSubplot at 0x7f06e348feb8>